




A quarterly business review presentation scores the last quarter against the commitments made for it, explains the results, names the risks carried forward, and asks the room to decide specific things. It reports on a period, but its output is a set of choices.
The failure mode is the KPI dump: forty slides of dashboard screenshots, one metric each, no argument connecting them. Everyone leaves informed and nothing gets decided. A decision-led QBR organizes around four questions instead — what happened, why, what could break next quarter, and what we decide today.
Why quarterly reviews collapse into dashboards
Usually it starts with instrumentation as agenda. Teams present what the dashboard tracks rather than what the quarter meant, so the deck inherits its structure from a tooling layout that was never meant to make an argument.
Topic titles finish the job. A slide titled "Churn" tells you which folder the content came from. "Enterprise churn doubled after the March pricing change" makes a claim the room can accept, challenge, or act on. Microsoft's PowerPoint accessibility guidance recommends unique, descriptive slide titles so people can navigate a deck; in a QBR the same habit is what makes the sequence readable as an argument.
And presenting every metric protects the presenter from the accusation that something was hidden, at the cost of the two numbers that mattered.
The four sections of a decision-led QBR
Order the deck the way a leadership team reads: result, cause, exposure, choice.
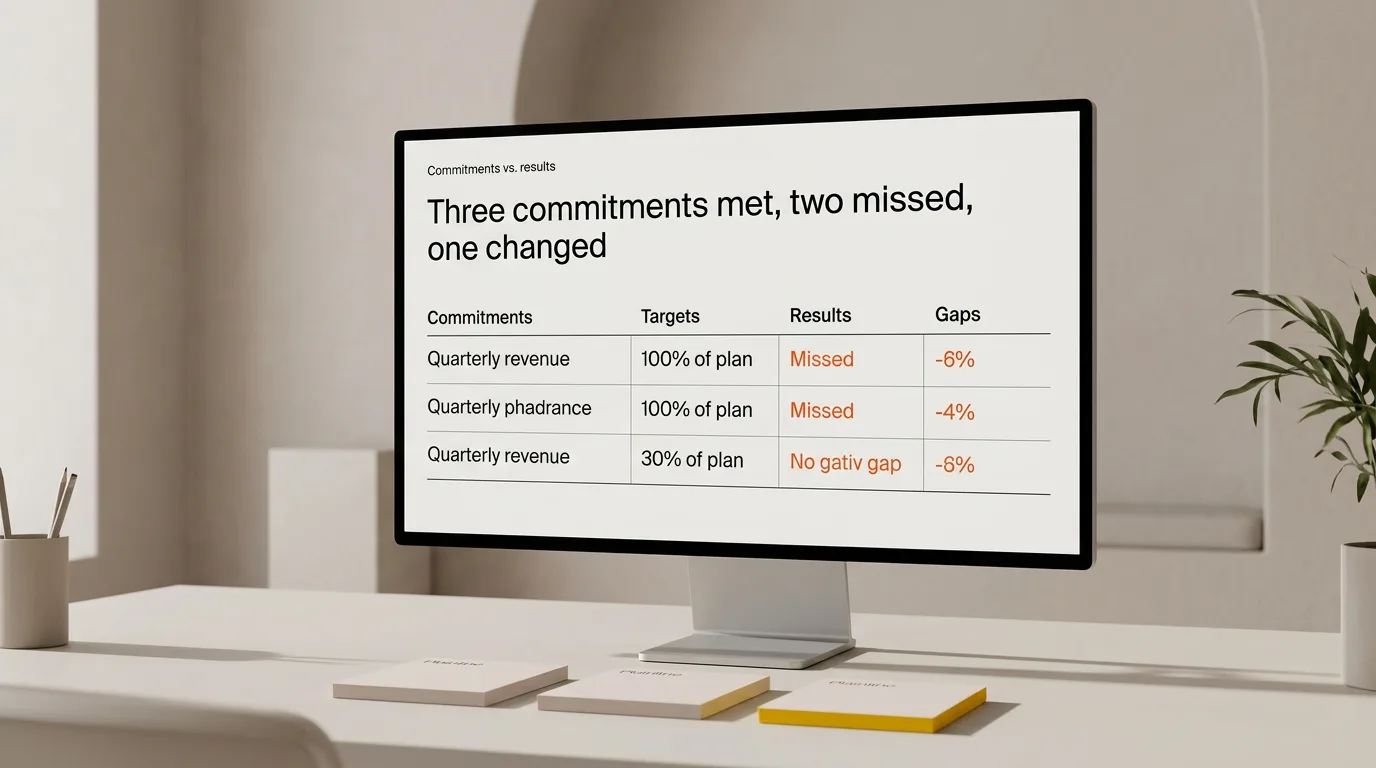
- Outcomes. Each commitment from last quarter with its result — met, missed, or changed — and the size of the gap. One line per commitment before any chart appears.
- Explanations. Why the misses happened, and why the wins happened. A win nobody can explain is not a repeatable win, and an unexplained miss will repeat.
- Risks. The trigger you are watching, the effect if it fires, the response you would take.
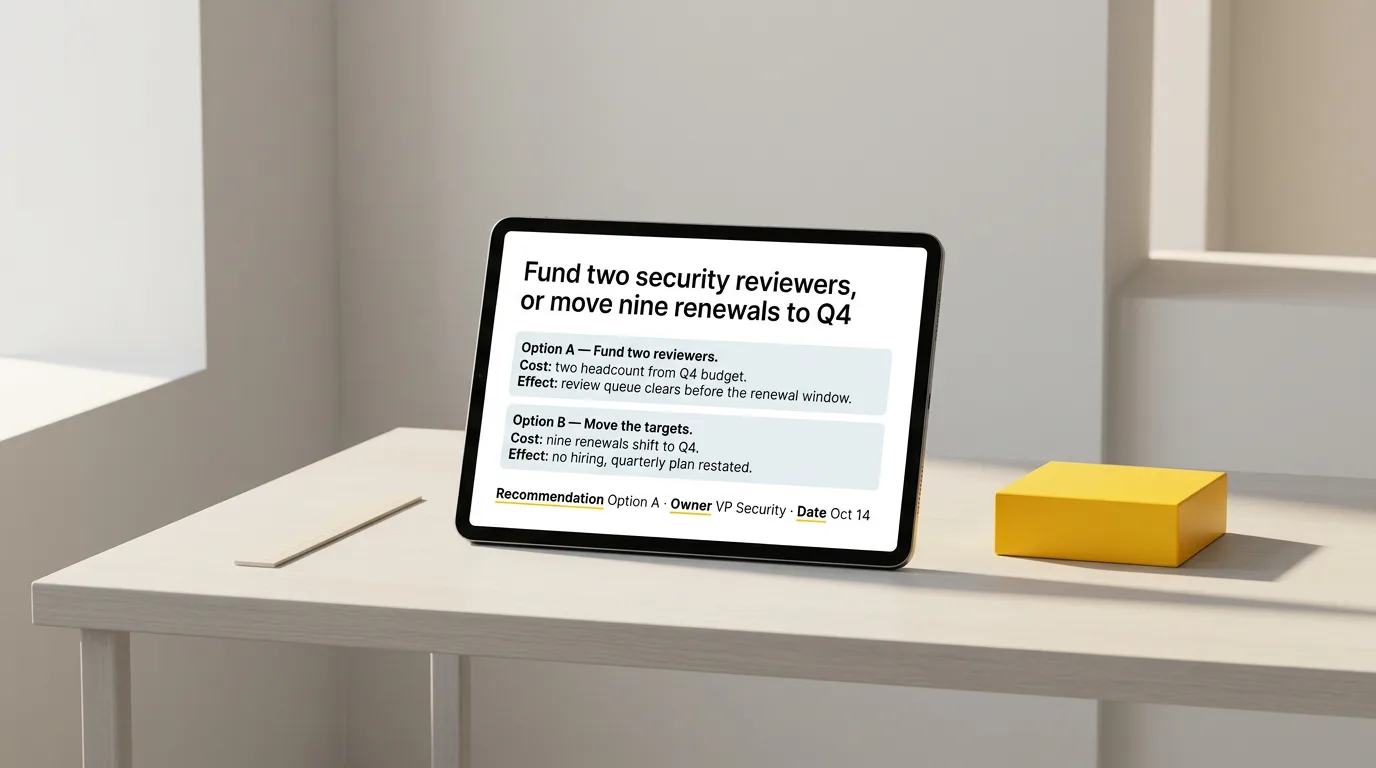
- Decisions. What the room must decide today — each with options, the tradeoff, an owner, and a date.
Metric detail, cohort breakdowns, and workstream status go in an appendix behind the decisions, organized so you can jump to a question without lengthening the main sequence.
A sample QBR deck, slide by slide
Ten to fourteen slides carry a normal quarter:
| # | Slide | What it says |
|---|---|---|
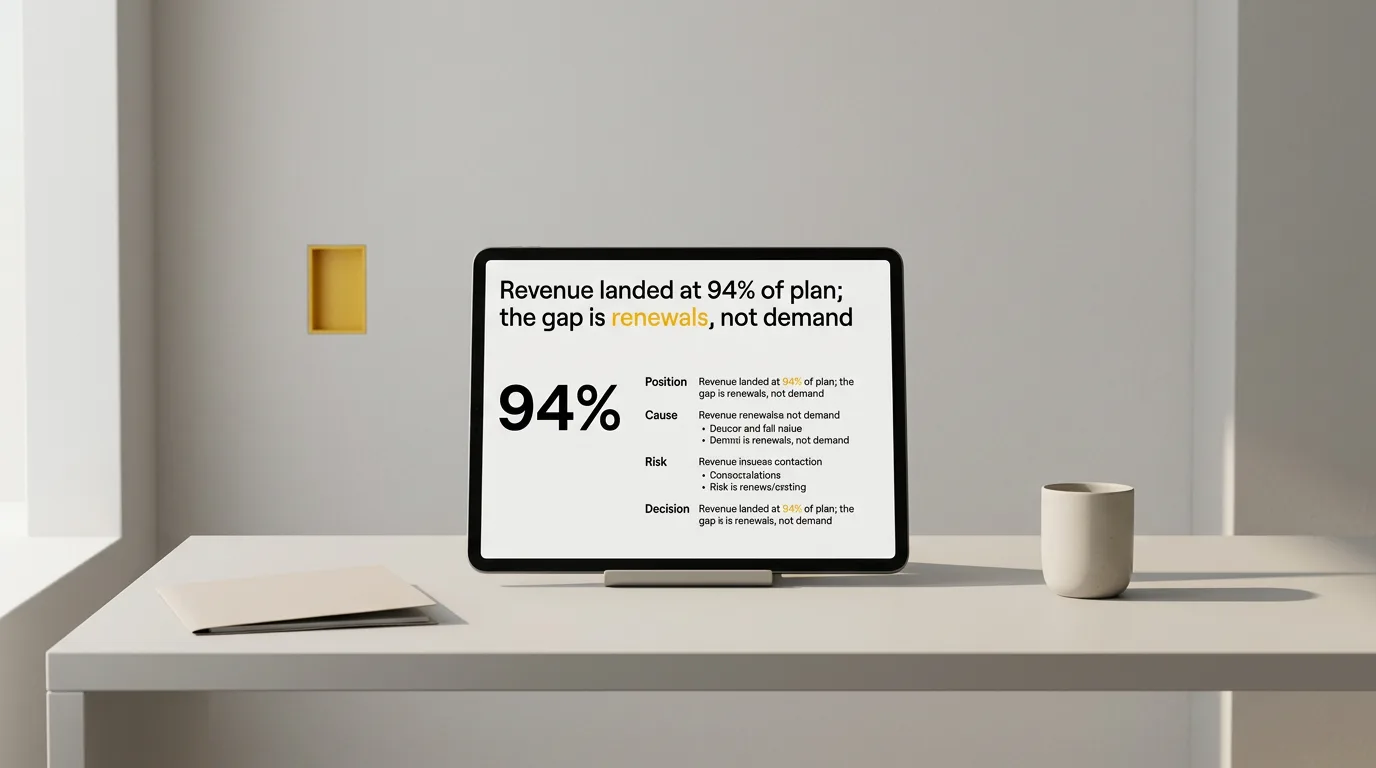
| 1 | Quarter in one slide | Overall position, the single most consequential fact, and the number of decisions requested |
| 2 | Commitments vs. results | Last quarter's commitments as rows, each marked met, missed, or changed, with the gap |
| 3–4 | What drove the result | Two or three causes with the evidence behind each, not a walkthrough of every metric |
| 5 | What we learned | What we now believe that we did not believe at the start of the quarter |
| 6 | Risks carried forward | Trigger, impact, response — one row per risk |
| 7–8 | Decisions requested | One decision per slide: options, tradeoff, recommendation, owner, date |
| 9 | Next quarter's commitments | What we are signing up to, stated so next quarter's slide 2 can score it |
| 10+ | Appendix | Full metrics, methodology, workstream detail |
Slide 2 and slide 9 are the same slide one quarter apart. If you cannot write slide 9 in a form that slide 2 can grade, the commitment is too vague to review.
Write the summary slide first
If the first slide will not write, the quarter is still a pile of activity rather than a position. Four lines carry it:
Position. Revenue landed at 94% of the quarterly plan; net retention improved for the third quarter running. Cause. The shortfall is concentrated in enterprise renewals delayed by the security review backlog, not in new business. Risk. Nine enterprise renewals in the next quarter sit behind the same review queue. Decision. Fund two security reviewers now, or move the renewal targets to the following quarter.
No chart, no build. The rest of the deck now has a job: prove those four lines and give the room what it needs to choose.
Choose evidence that could change the decision
A metric earns a main-deck slide when it supports the position or bounds a named risk. Check that its comparison is the one a leadership team would reach for — against the commitment, against last quarter, against the alternative on the table. Then remove the chart in your head. If the decision does not change, the chart belongs in the appendix.
Comparisons also decide how honest the deck reads. If your quarterly results carry adjusted or custom measures alongside reported financials, follow the discipline the SEC applies to public disclosure in its non-GAAP financial measures guidance: a non-GAAP measure presented with more prominence than the comparable GAAP measure is treated as misleading. Internal decks are not filings, but a slide that shows only the flattering adjusted figure trains a room to distrust the next one.
For risks, the UK government's guidelines for managing projects call for reporting the impact of issues and changes alongside revised cost and schedule forecasts. Impact is the operative word in a QBR too: a risk stated without its effect on revenue, date, or scope is not yet decision material.
QBR vs. adjacent formats
These three get confused because they cover overlapping material for different rooms.
| Quarterly business review | Executive update | Status update | |
|---|---|---|---|
| Cadence | Quarterly | As needed, often monthly | Weekly or biweekly |
| Scores | Commitments made a quarter ago | The current position vs. plan | Work completed since last time |
| Core question | Did the strategy work, and what changes | What do you need from us now | Are we on track this week |
| Risks | Carried forward with a response plan | Escalated with impact | Full register with owners |
| Ends with | Next quarter's commitments | A named ask, owner, date | Next work and dependencies |
When the review only needs to report position and secure one decision, the shorter executive update presentation format does the job without a quarterly frame. For delivery-level reporting between reviews, use the project status update presentation structure. When the review is a monthly marketing read rather than a quarterly one, the five-section results order is the closer fit. If your QBR runs across several audiences with different stakes in the outcome, the rules for what to include and leave out per group apply before you cut slides.
Build the deck from the quarterly report you already have
Most QBRs start as a written report or a metrics doc, so the thinking exists and assembling slides is the slow part. Work in this order:
- List last quarter's commitments in their original wording, before looking at any results. Wording chosen after the fact quietly moves the goalposts.
- Score each commitment met, missed, or changed, with the size of the gap.
- Write one cause per miss and per notable win. A cause you cannot state in a sentence is a research task, not a slide.
- Tag every remaining paragraph as outcome, explanation, risk, or decision. Untagged material goes to the appendix.
- Reorder the source into the four sections before generating anything. Order fixed in text is order fixed in the deck.
- Rewrite each heading as a claim so the headings become slide titles that assert something.
- Generate the slides, then read only the titles. They should form the argument end to end without the charts.
- Edit content and sequence first, layout second. Layout built on a wrong sequence gets thrown away.
If the source is a long analytical report rather than a summary, extract the findings and implications first so the QBR inherits conclusions instead of chapters.
Turn your quarterly report into a QBR deck
The mechanical part — splitting the text, choosing compositions, aligning elements, keeping typography consistent across fourteen slides and four appendix sections — is the part worth removing. Plainline takes the written report, splits it into slides, identifies which parts are claims, numbers, quotes, or conclusions, and applies consistent layouts. After generation you edit the content, slide order, semantic blocks, layout variants, and media, then preview, share, or export.
Which commitments were actually met, what caused the gap, which risks are worth funding — that judgment stays with you. Paste the report once the four sections are in the right order.
Frequently asked questions
How long should a quarterly business review presentation be?
Ten to fourteen main slides plus an appendix, for a sixty- to ninety-minute review. Length should follow the number of decisions requested, not the length of the quarter. If every QBR runs the same forty slides regardless of what happened, the deck is recording activity rather than supporting choices.
Who should present the QBR?
Whoever owns the commitments being scored, not a central analyst assembling numbers on their behalf. The explanation slides are the hard part of the meeting, and they need someone who can answer follow-up questions about cause without deferring. Analysts can prepare the appendix.
Should the QBR deck go out before the meeting?
Send it if the room needs time to weigh the decisions, and make the first slide readable standalone — no build, no verbal setup. Quarterly decks circulate widely afterward, so any slide that only makes sense when narrated will eventually be read without the narration and misinterpreted.
What if the quarter's results were bad?
Put the result on the first slide with the gap sized honestly, then spend the deck on cause and response rather than on softening. A room that has to extract the bad number from slide nineteen stops trusting the reporting cadence, which costs more than the quarter did.
Do internal QBRs and customer QBRs use the same structure?
The four sections hold, but the commitments differ. A customer QBR scores what you promised that account and asks for renewal, expansion, or scope decisions; an internal QBR scores team commitments and asks for resourcing or strategy decisions. Do not merge them into one deck.
Sources
- Make your PowerPoint presentations accessible to people with disabilities — Microsoft Support
- Compliance and Disclosure Interpretations: Non-GAAP Financial Measures — U.S. Securities and Exchange Commission, Division of Corporation Finance
- Guidelines for Managing Programmes and Projects — UK Government (Department for Business, Innovation and Skills)