




Start with the decision the audience needs to make. Extract the report’s conclusions and supporting evidence. Put the rest in the appendix or cut it. Each slide should state a conclusion and show enough evidence for an executive to judge it.
An executive presentation is a short deck that carries a report’s conclusions, their implications, and the decisions they require to the people who must act on them. It does not summarize the report evenly; it selects the parts that change a decision and leaves the rest retrievable in the source document.
Seven steps take a long report to that deck:
- Write a one-sentence brief naming the audience, the decision, and the meeting.
- Build an extraction sheet of conclusions, evidence, and implications instead of converting sections.
- Sort every piece of source material into keep, cut, or appendix against that brief.
- Arrange the main deck as a chain from conclusion to evidence to decision.
- Define the claim, evidence, interpretation, and route to detail for each slide.
- Verify anything generated automatically against the source report.
- Run an executive-readiness check by reading the slide titles alone.
An executive presentation distills a report’s analysis into the findings, implications, and decisions needed for one meeting.
Give the presentation a narrower purpose than the report
Before outlining slides, write a one-sentence brief:
After this presentation, the leadership team should understand [finding] and decide [action].
If the meeting requires no decision, name the intended change in understanding:
After this presentation, the leadership team should understand [change or risk] and know [what happens next].
Add four constraints:
- Audience: who will see it, and what do they know?
- Outcome: decision, approval, alignment, or update?
- Time: how long is the discussion?
- Evidence threshold: what must the audience see before accepting the conclusion?
UK government guidance for audit reports distinguishes between executives who receive summaries and managers who receive the full report. It also recommends a logical structure for each management level. The editorial principle applies beyond audits: select detail for the people in the room.
Extract conclusions before writing slide titles
Converting the report’s sections into slides preserves its structure and length. First, make an extraction sheet for the full report:
| Field | What to capture | Test |
|---|---|---|
| Finding | What changed, happened, or was learned | Can you state it in one sentence? |
| Evidence | The strongest number, comparison, quote, or observation | Does it support the finding directly? |
| Implication | Why the finding matters to this audience | Does it affect a goal, risk, cost, or timing? |
| Action | What should happen next | Is there an owner or decision? |
| Qualification | A caveat that could change the interpretation | Would omitting it mislead the audience? |
This sheet exposes repeated findings and background that documents the work without supporting a conclusion. Keep the report’s wording until all claims and dependencies are visible, then shorten it.

Decide what to keep, cut, and move to the appendix
Use the audience brief, rather than a word limit, to place the source material.
| Destination | Put it here when | Typical report material |
|---|---|---|
| Main deck | The audience needs it to follow the argument or make the decision | Headline finding, decisive evidence, business implication, recommendation, material caveat |
| Appendix | It answers a likely question or lets someone verify the analysis | Method details, full data tables, segment cuts, definitions, secondary findings, sensitivity analysis |
| Cut | It neither advances the decision nor helps verify a claim | Repeated context, process narration, ornamental charts, detail unrelated to the recommendation |
Give each appendix slide a clear title and point to it from the relevant main slide. Keep a qualification in the main deck when it changes a finding’s meaning, limits the recommendation, or exposes a material risk.
The same reporting guidance recommends executive summaries for long reports and reference material in appendices.
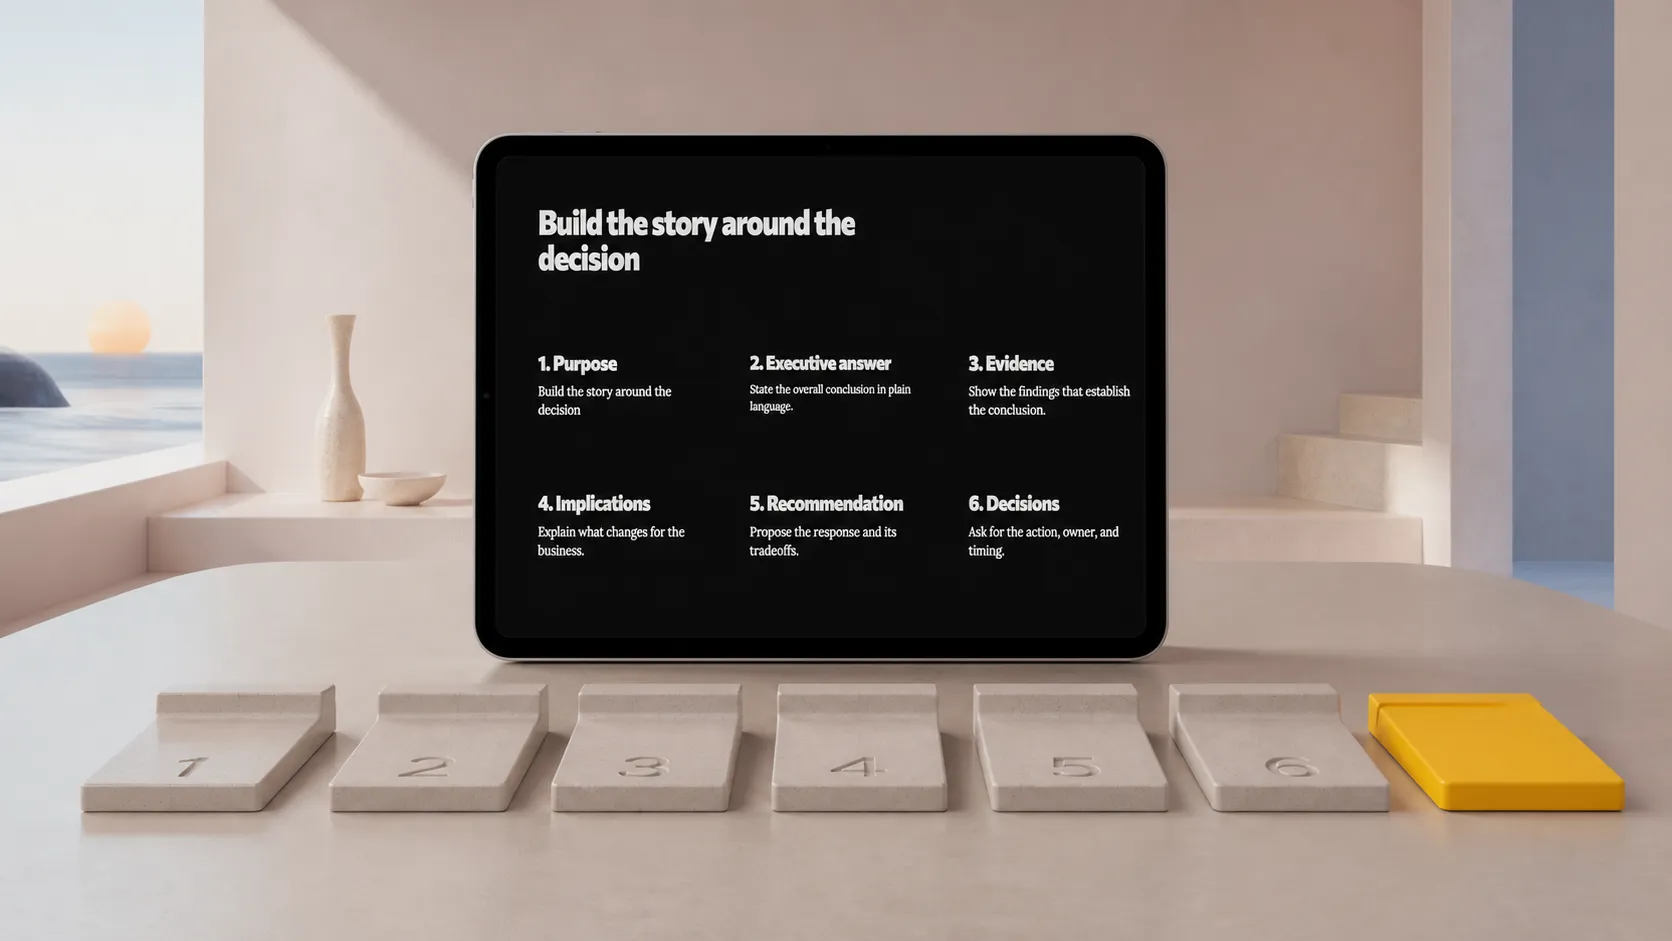
Build the executive storyline around conclusions
Arrange the main deck as a chain of reasoning:
- Purpose: what the review covered and what the meeting needs to resolve.
- Executive answer: the overall conclusion in plain language.
- Evidence: the findings that establish the conclusion.
- Implications: what changes for the business.
- Recommendation: the proposed response and its tradeoffs.
- Decision and next steps: what is needed, from whom, and by when.
Adapt the sequence to the material. One finding may need two slides; several small findings may fit on one if they support the same conclusion.
Write titles as claims:
| Topic title | Conclusion title |
|---|---|
| Customer retention | Renewal risk is concentrated in first-year accounts |
| Regional performance | Two regions account for most of the forecast gap |
| Recommendations | Reallocate onboarding support before the next renewal cycle |
The titles should carry the argument. The body of each slide supplies the proof.
Example: turn a 42-page operating report into an eight-slide deck
Consider a hypothetical 42-page quarterly review of a service expanding into three regions. Leadership must decide whether to continue the rollout or change the next quarter’s investment.
The editorial brief reads:
After this presentation, the leadership team should understand why adoption is on plan while service costs are above plan, and decide whether to fund two operational changes before expanding further.
Keep rollout status, adoption against plan, the two cost drivers, customer impact, the recommendation, and the decision. Move methods, full regional tables, cost-model assumptions, definitions, and alternative scenarios to the appendix. Cut project chronology, repeated descriptions of the regions, and duplicate charts.
The main deck could contain eight slides:
-
The rollout is meeting its adoption target, but service costs threaten the expansion case
Give the answer, two supporting metrics, and the required decision. -
Adoption is broadly on plan across all three regions
Show actual versus plan and one relevant qualification. -
Two operational bottlenecks account for most of the cost gap
Show each bottleneck’s contribution to the variance. -
Longer onboarding is increasing support work and delaying customer activation
Connect the cause to its customer and cost effects. -
The current expansion schedule would carry both bottlenecks into the next region
Show the consequence of continuing without changes. -
Two changes address the bottlenecks before the next launch
Name the actions, owners, timing, and tradeoffs. -
Leadership needs to choose between a short delay and a higher operating-cost risk
Compare both options against the same criteria. -
Decision and next checkpoint
State the requested approval, immediate actions, and review date.
The appendix holds the supporting analysis, including the regional table an executive may request. The report, findings, and figures in this example are hypothetical and do not describe a real company.
Summarize the report slide by slide
Define four elements for each slide: its claim, evidence, interpretation, and route to supporting detail.
Suppose the report says:
Support costs exceeded the quarterly plan. Analysis by workflow shows that implementation questions and manual account configuration created most of the additional workload. The effect was strongest during the first weeks after launch.
A slide titled “Support costs” only repeats the topic. “Implementation work is driving the support-cost gap” states the conclusion. Add the relevant comparison and timing; move definitions and the full workflow breakdown to the appendix.
Microsoft’s presentation guidance recommends short, simple slide text and clear chart labels. On-screen text should cue the presenter rather than reproduce the report. Keep a chart when its shape or comparison is evidence. If only one value matters, show the number.
Use report-to-presentation AI for structure, then verify the result
Report-to-presentation AI can propose slides, identify claims and evidence, and place them in consistent layouts. The author still has to verify the argument against the source report.
Review an AI-generated draft in this order:
- Trace each claim to the report. Remove unsupported additions and restore material qualifications.
- Read only the slide titles. Check that they form an argument and lead to the requested decision.
- Check whether each chart, number, or example proves its title.
- Move detail to the appendix without hiding material risk.
- Edit the language and structure before adjusting layouts or media.
Run an executive-readiness check
Before sharing the presentation, check:
- Can someone state the overall conclusion after the first two content slides?
- Does each title make a claim or identify an action?
- Does each visual support its title?
- Do the report’s findings support each recommendation?
- Are material caveats visible in the main deck?
- Is the requested decision explicit, including options or tradeoffs?
- Can the source report verify the analysis, with likely questions covered in the appendix?
If the logic fails, return to the extraction sheet before changing typography.

Generate an editable first deck from the report
This workflow needs only a document, an outline, and a slide editor. Plainline shortens the assembly step: paste the report, generate a structured deck, then edit the content, slide order, semantic blocks, layouts, and media. The deck remains editable while the appendix stays connected to the main story.
When the report is a research write-up, lead with the finding rather than the method; when it asks for money or approval, the business proposal structure fits better; when it is a monthly channel report, the five-section results order does the cutting. Place the one-sentence audience brief at the top of the source. Use it to judge every slide in the generated deck.
Frequently asked questions
How long should an executive presentation from a report be?
As long as the decision needs, which is usually eight to twelve slides for a 40-page report. Length is set by the number of conclusions the audience must act on, not by a compression ratio. Everything that supports but does not change the decision moves to the appendix.
What do I cut when turning a report into a deck?
Method, background, and any finding that does not change the decision in front of this audience. Keep the conclusions, the evidence an executive needs to judge them, the implications, and the requested decisions. Cut material stays in the report, which remains the reference the deck points to.
Should the slides follow the report's section order?
No. A report is organized by subject, an executive deck by argument: conclusion, supporting evidence, implication, decision. Converting sections into slides reproduces the report's structure and buries the findings behind the method, which is exactly what the deck exists to avoid.
Can AI summarize a report into an executive deck?
It can produce a structural first draft quickly. Verify every claim, number, and timeframe against the source report before presenting, because a summarizer optimizes for plausible compression, not for the specific decision your meeting must produce. The reviewer, not the tool, owns the accuracy of the deck.